Measuring how AI rewrites the demand for work.
Most claims about AI and jobs rest on aggregate data. Hiring happens one firm, one year, one advert at a time — and that is the level almost nobody measures.
The AIFE Engine
A job advert is a firm telling you, in its own words and at its own expense, what work it needs done next. Read enough of them and you have a record of technological change as it happens, one hiring decision at a time, without waiting two years for a statistical agency to publish.
The obstacle has always been reading them. Counting the word “AI” in a posting tells you almost nothing — a marketing team that mentions “AI-powered” four times scores higher than a firm quietly hiring three people to fine-tune models. The published exposure indices have the opposite problem: they score occupations for how automatable they are in principle, which is a claim about the job title rather than about the company doing the hiring.
Reading 100 million adverts
The pipeline starts with the Web Data Commons extraction of structured job-posting markup from Common Crawl — roughly 412 million records, which deduplicate to about 100 million distinct postings between 2015 and 2024. Employer names arrive in every variant imaginable, so a first pass resolves “NVIDIA Corp.” and “NVIDIA Corporation — Santa Clara” back to one firm.
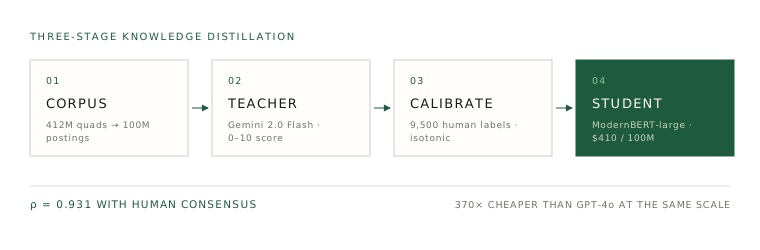
A frontier model then reads a sample of those postings and scores each one from 0 to 10, against a rubric that separates using a tool from building one. Those scores are checked against 9,500 postings labelled by hand, the disagreements are used to correct the model's systematic drift, and the corrected labels train a much smaller encoder that can afford to read all hundred million. That last step is the whole trick: scoring the full corpus with the frontier model would cost about $98,000. The distilled model does it for $410, and keeps a correlation of 0.931 with the human labels.
What the panel shows
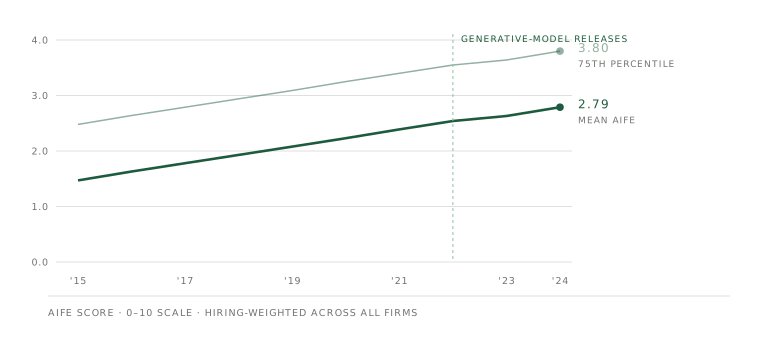
Averaged across every firm, AI intensity nearly doubles over the decade — from 1.47 in 2015 to 2.79 in 2024. The gap between firms widens as it does: the interquartile range grows from 1.86 to 2.42 over the same decade, so firms are spreading apart rather than moving up as a block.
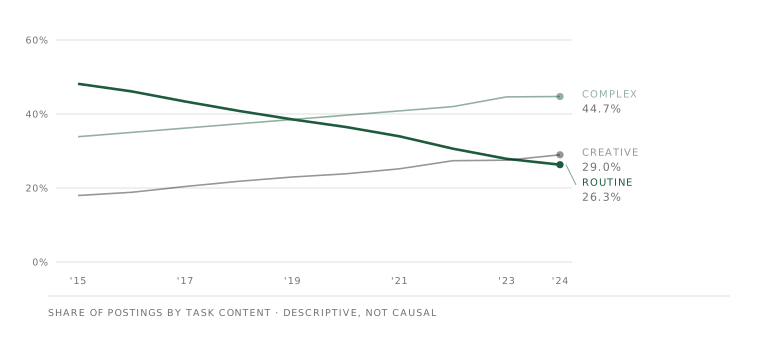
The composition of the work being advertised moves at the same time. Postings whose tasks are repetitive and rule-based fall from 48.2% of the corpus to 26.3%. Postings calling for judgement under uncertainty rise from 33.9% to 44.7%, and those calling for genuinely novel output rise from 18.0% to 29.0%.
Correlation, and then the harder question
Two lines moving in opposite directions over the same decade prove nothing on their own. Plenty of things changed between 2015 and 2024, and firms that adopt AI early are unusual firms to begin with — better capitalised, more technical, already drifting away from routine work.
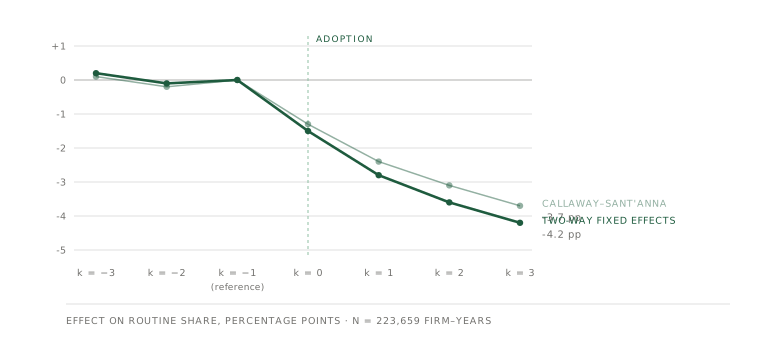
The paper attacks that in three ways. A fixed-effects panel compares each firm against itself and each industry against itself in the same year, so the estimate rests on within-firm change rather than on which firms are in the sample. An event study then checks the years before adoption: if adopters were already shedding routine roles faster than their peers, the pre-period coefficients would show it. They sit on zero. After adoption the effect appears immediately and keeps deepening, reaching −4.2 percentage points by the third year.
Third, a shift-share instrument predicts each firm's exposure to the AI wave from the occupations it staffed in 2012–2015, crossed with how fast those occupations moved nationally with the firm itself excluded. That instrument is the least comfortable part of the design, and the paper says so: both halves of it are built from the same job-posting data as the outcome, and the first-stage F-statistic is high enough to warrant suspicion of a mechanical link.
What survives all three is a consistent story: 2.1 percentage points off routine hiring and 1.8 onto creative hiring per unit of AI intensity. The effect is twice as large in high-income countries and concentrated among large firms — an automation divide.
Forecasting the next three years
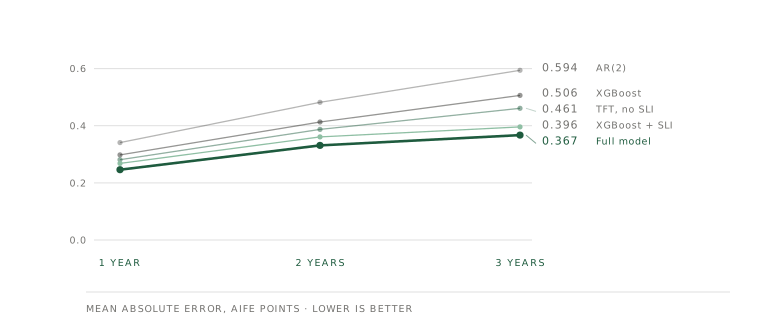
A firm's score history is a poor predictor of where it is going, because a firm can be visibly changing its language before that shows up in the number. So the forecasting stage reads the encoder's internal representations rather than its output — how fast a firm's postings are drifting toward the frontier's vocabulary, how much its roles disagree with one another, how far it still is from the leading edge. At a three-year horizon the model leans on those features roughly twice as heavily as on the score history itself.
What it cannot tell you
The corpus is demand-side. It records what firms say they want, not who they hired, what they paid, or what happened to the people they stopped hiring — so nothing here speaks to wages, skill mismatch, or welfare. It over-represents English-language postings from formal-sector firms with a web presence, which leaves informal labour markets and low-connectivity economies largely outside the frame.
And the central variable is itself a model output. Every estimate that uses it inherits its measurement error, which is why the paper reports a second set of standard errors that resample the whole pipeline rather than treating the score as observed. External validation against something independent — IT capital spending, patent filings, software licences — would settle far more than another robustness check on the same data.
The economics, under competition conditions.
Gold medal, ranked ninth in the world on an individual score of 176.76. I captained Team China-1 to silver in the Business Case, second in the world. The captain's job was the preparation plan and deciding which analysis went to whom.
Gold Award for original research in economic and financial modelling.
Top Gold, sat two years early. Filed here because the modelling habit started with physics.